Project Visitors
The project's Visitors page shows who reaches your application: how many unique visitors, how many pages were viewed, from which countries, which pages and where people came from. There is no script, tag or cookie to install: the numbers come from the requests that reach the application.
How to access it
- In the side menu, click Projects
- Open the project you want
- Click the Visitors block, right above Resource usage
Video: the Visitors page along with logs, resource usage, healthcheck and alerts of a project. See Observability.
What the page shows
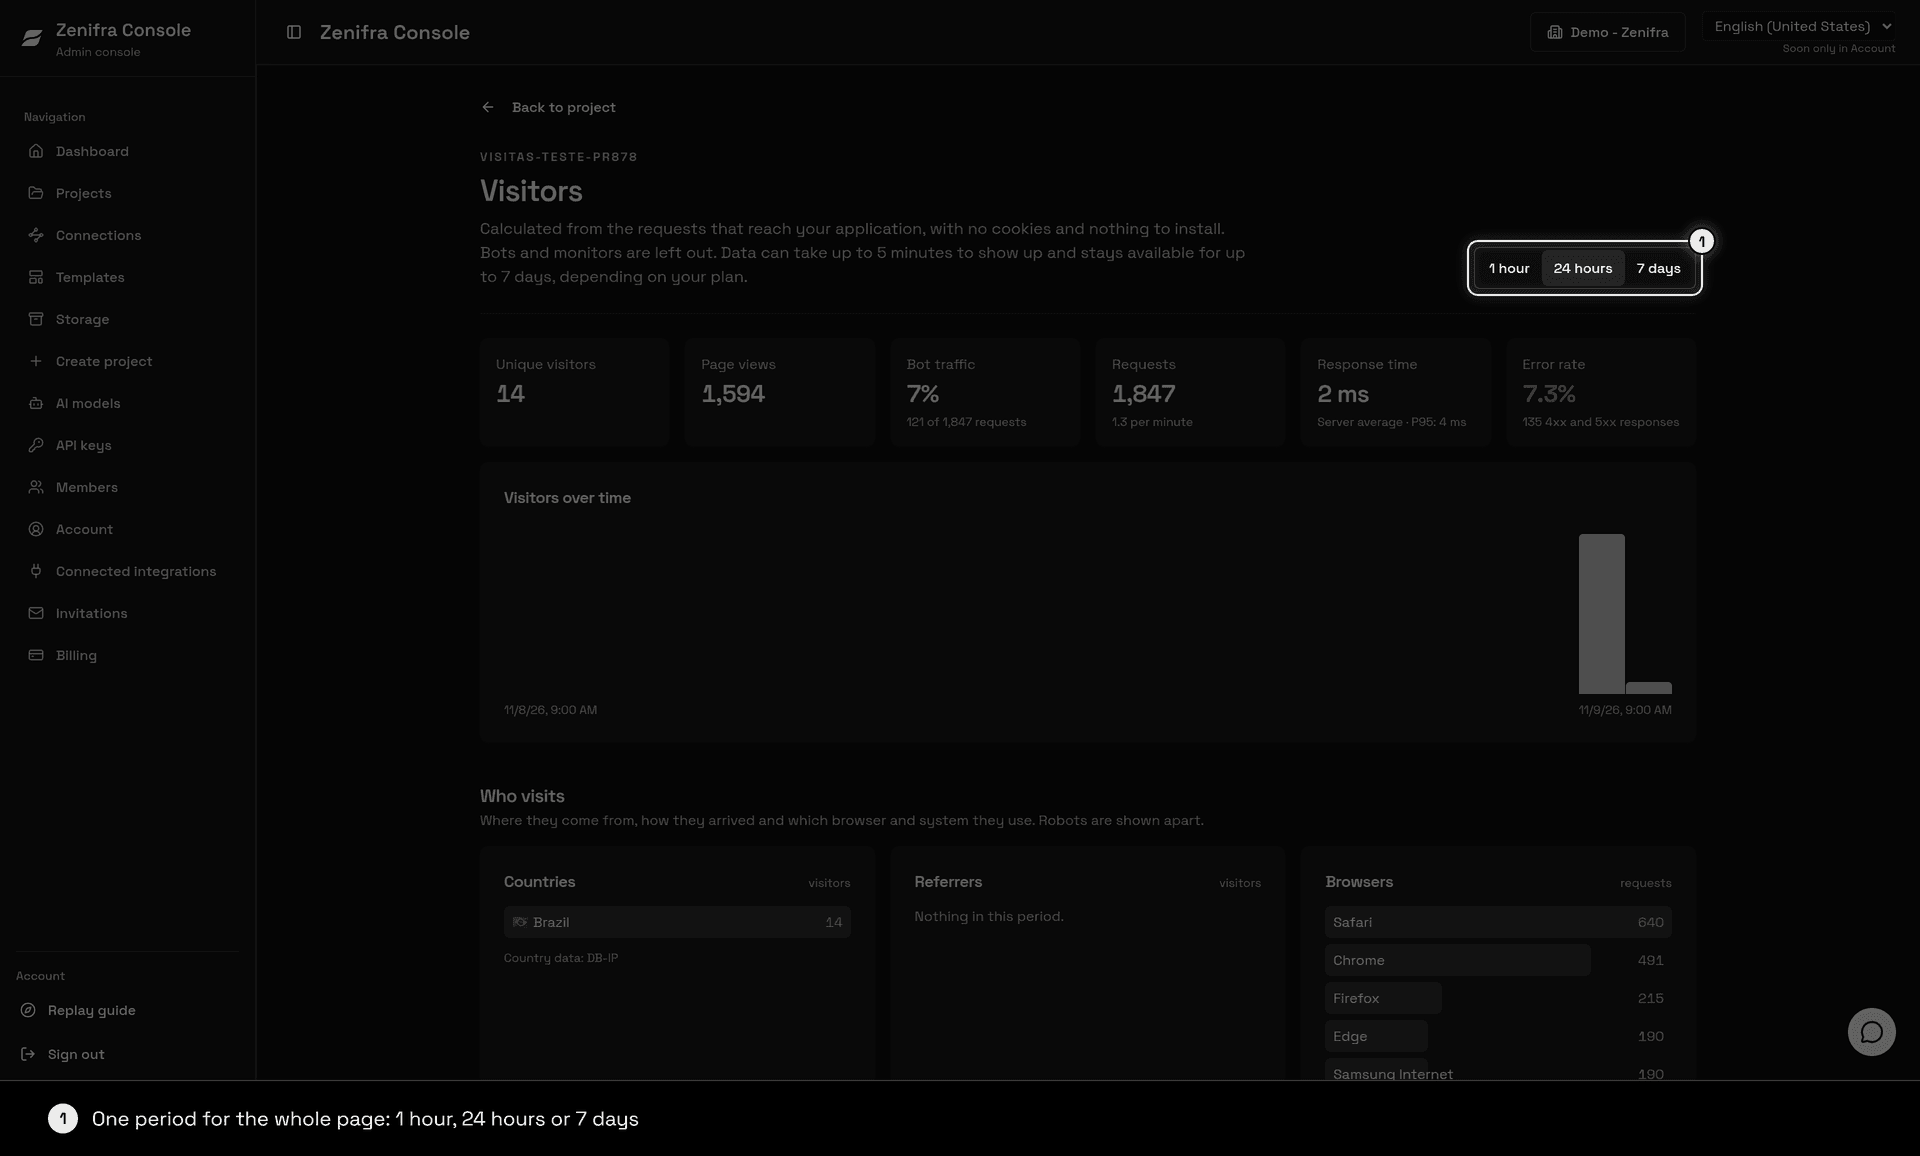
One period selector, 1 h, 24 h or 7 days, applies to the whole page. The chart uses your browser's time zone.
The period's numbers sit at the top, with the Visitors over time chart right below:
| Item | Description |
|---|---|
| Unique visitors | How many distinct people visited in the period |
| Page views | How many pages were viewed in the period |
| Bot traffic | Share of requests made by robots |
| Requests | Total HTTP calls and the average per minute |
| Real latency | How long the visitor waits, on average, until the first byte of the response, with the approximate P95 right below |
| Response time | Average time the application takes to respond, measured where the request enters the platform (without the visitor's network), with the P95 right below |
| Error rate | Share of 4xx and 5xx responses |
Who visits
- Countries: where the visitors come from
- Real latency: measured on requests from real visitors, with no script and without robots, from the visitor's network to the first byte of your application's response. Downloading the whole response depends on the visitor's internet speed. Collecting shows while the period does not have enough data yet.
- Referrers: the sites people arrived from; Direct when there is no origin
- Browsers and Systems: which browser (Chrome, Safari, Firefox, Edge…) and system (Android, iOS, Windows, macOS, Linux) people use
- Robots and automation: the traffic left out of the visitors, split into search engines and AI, link previews, uptime monitors, scripts and tools, automated browsers and others
- Top source IPs: the addresses that called the application most
What they access
- Top pages: the pages people opened
- Most requested routes: method and path, with requests, average real latency, application time (average and P95) and error rate of each route
How the application responds
- Response status: distribution across
2xx,3xx,4xxand5xx. Click a class to open the drill-down with the routes, user agents and requests of that response - Application response time: average, P95 and the data received and sent
Browsers, systems, robots, IPs, routes, real latency, response time, error rate and response status are part of plans with metrics (Premium or higher). On other plans, the page shows the visitors and a note in those sections. Browsers, systems and robots count requests; countries and referrers count visitors.
How the numbers are calculated
- Unique visitor: the same network address with the same browser within the period. The count is approximate: one person using two browsers counts twice, and several people behind the same address and browser count once.
- Page view: estimated from page requests. Files such as scripts, styles, images and fonts are not counted. In API-only applications, requests that return JSON may be counted as page views.
- Bots and monitors: search crawlers, uptime monitors and automated tools are left out of visitors and page views; they only show up in the bot traffic percentage.
- Referrer: we keep only the origin site, never the full address or campaign parameters. Collection starts on the feature's launch date; earlier periods show Collecting since the start date.
Values Zenifra fills in
Some rows do not come from a name the request carried: Zenifra fills them in when the information is missing or does not fit the other categories. In the console, hover over (or tap) the name to see the explanation.
| Where it shows | Value | What it means |
|---|---|---|
| Referrers | Direct | The browser did not say where the person came from: a typed address, a bookmark, a link opened in an app (WhatsApp, email, Instagram) or a site that hides the origin |
| Countries | Unknown | The country could not be found from the visitor's IP |
| Browsers | Others | Browsers outside the list (Chrome, Safari, Firefox, Edge, Opera and Samsung Internet), added up |
| Systems | Others | Systems outside the list (Android, iOS, Windows, macOS and Linux) or that the browser does not report, added up |
| Robots and automation | Search engines and AI | Search engine and AI robots that read the site (Google, Bing, GPTBot, ClaudeBot…) |
| Robots and automation | Link previews | Apps that open the page to build a link preview (WhatsApp, Facebook, X, LinkedIn, Slack, Telegram, Discord) |
| Robots and automation | Uptime monitors | Services that check whether the site is up |
| Robots and automation | Scripts and tools | Command-line and code tools (curl, wget, Python, Postman…) |
| Robots and automation | Automated browsers | Browsers driven by a program (Lighthouse, Puppeteer, Playwright, Selenium) |
| Robots and automation | Unidentified | Requests that arrived without a User-Agent |
| Robots and automation | Other robots | Other robots and programs that do not present themselves as a browser |
| Real latency | Collecting | The period does not have enough data yet to calculate the real latency |
| Referrers | Collecting since | Referrer collection started after the beginning of the chosen period; the date shows when it started |
Delay and history
Data shows up with a delay of up to about 5 minutes. Available history goes from 1 to 7 days, depending on your project's plan. Periods your plan does not cover appear disabled on the Visitors page.
Who can see it
The page is available to members with the project.network.visitors.read permission on the project, which the owner has by default. Without it, the page shows an access-denied message. On a plan that does not include Visitors, the page shows an invitation to change plan.
Note: Country data: DB-IP, shown on the page.
Next Steps
FAQ
Do I need to install anything in my application?
No. There is no script, tag or cookie: counting comes from the requests that reach the project.
Why is the visitor count approximate?
Because a visitor is identified by network address and browser, without a cookie. The count is therefore an estimate.
Why don't I see referrer data for older periods?
Referrers are only collected from the feature's launch date on. Before that, the page shows Collecting since the start date.
Last updated on
HTTP Project Metrics and Insights
Use the HTTP project metrics and insights tab on Zenifra: logs on all plans, CPU, RAM, and requests on Premium or higher, network traffic, and storage usage.
Database Projects
Create and manage PostgreSQL (15 to 18) and MariaDB (10 and 11) database projects on Zenifra from the console: creation, settings, metrics, and insights.