Organization logs
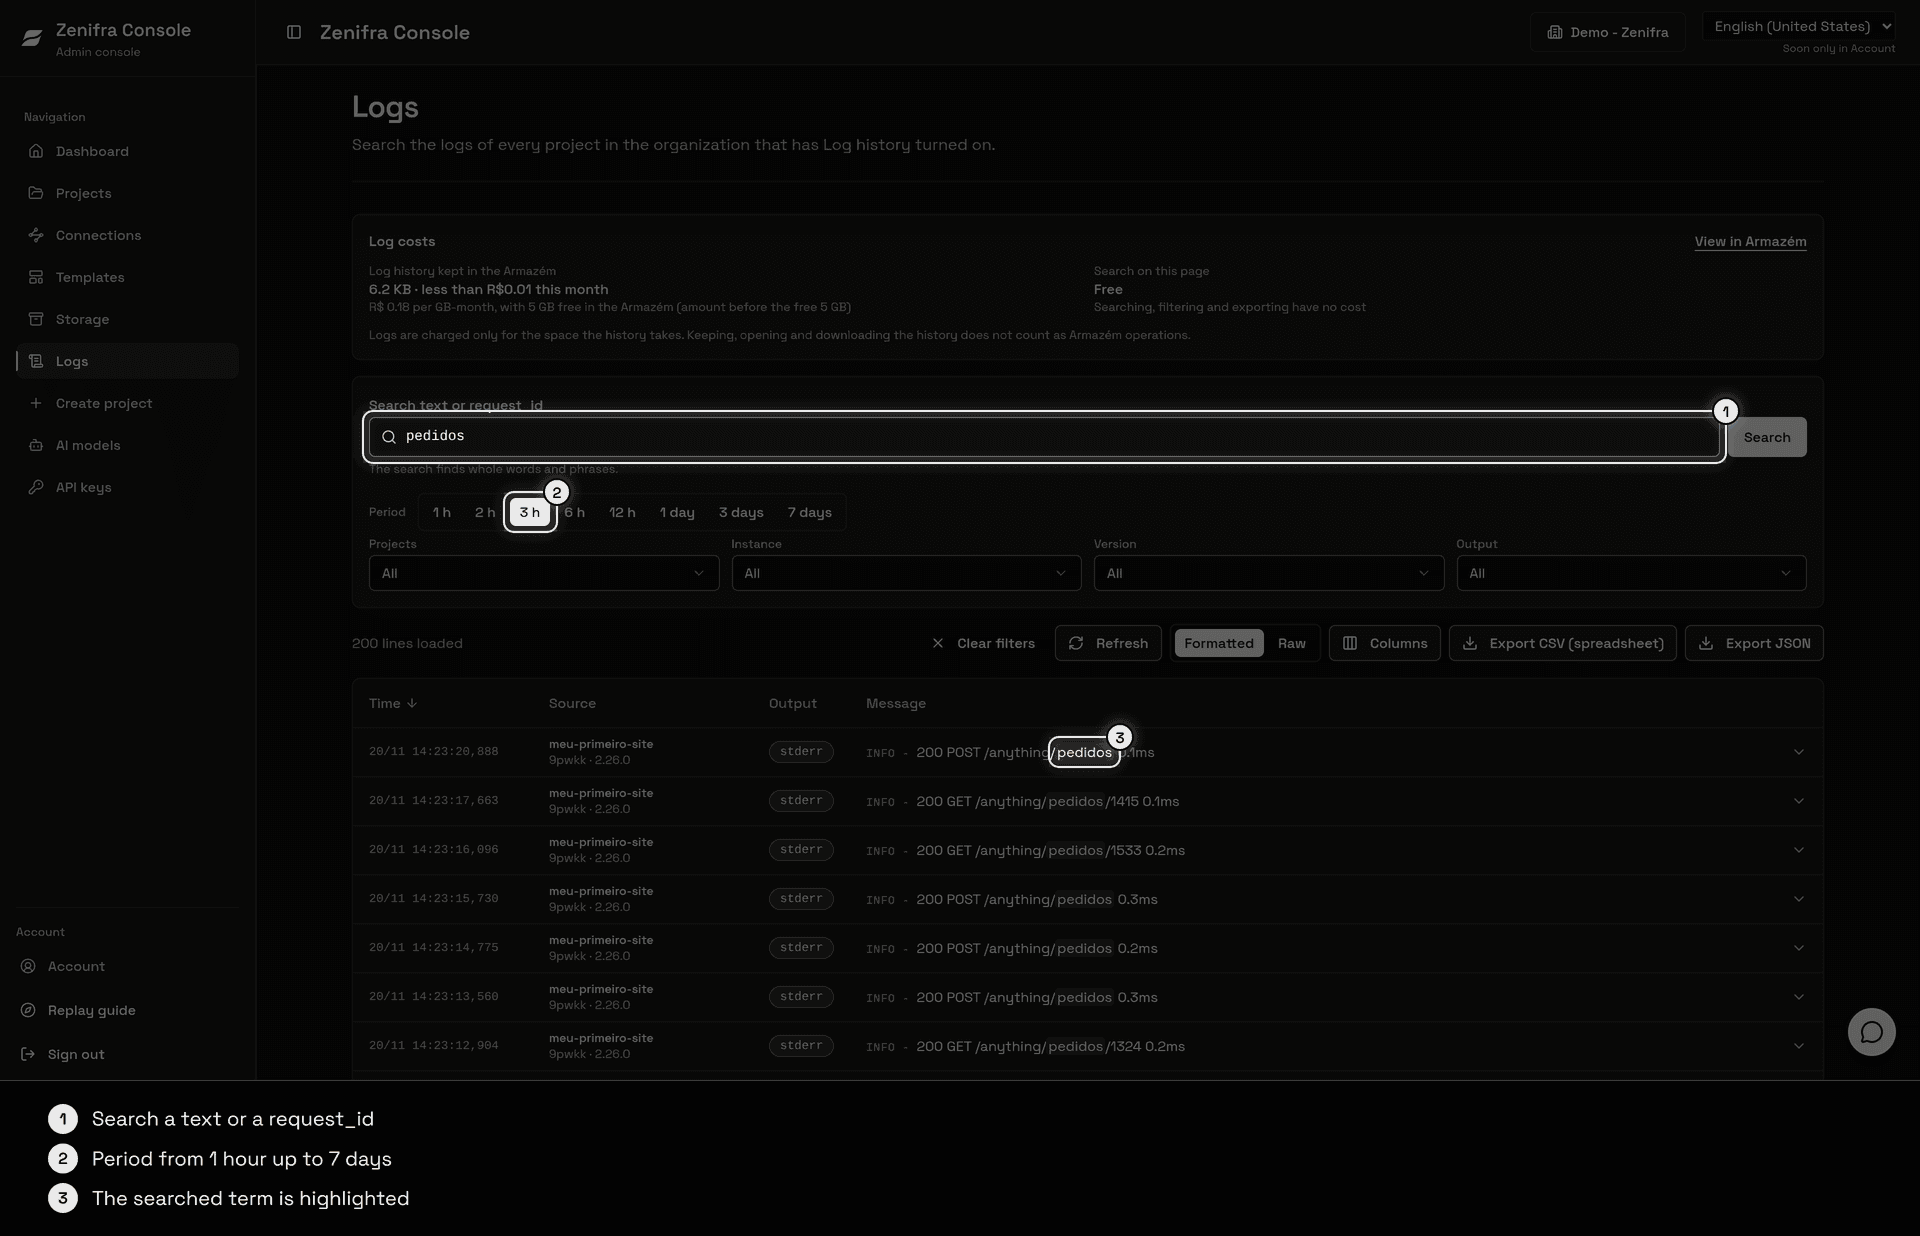
The Logs page in the console searches, in one place, the logs of every application in your organization that has Log history turned on. The search covers the last 7 days.
Requirements
- Log history turned on for the project. Only HTTP applications have history.
- Object Storage created in the organization.
- Log read permission (
project.logs.read). See Required permissions.
You only see logs from projects in your organization that have Log history turned on and that your account can read.
How to search
- In the console sidebar, open Logs.
- Choose the period: from 1 hour up to 7 days.
- Type free text or a
request_idand search. - Optionally, narrow down with the filters.
Filters
| Filter | What it does |
|---|---|
| Period | Ready-made periods, from 1 hour up to 7 days |
| Project | Limits the search to one or more projects |
| Instance | Limits the search to one instance |
| Version | Limits the search to one application version |
| Output | stdout or stderr |
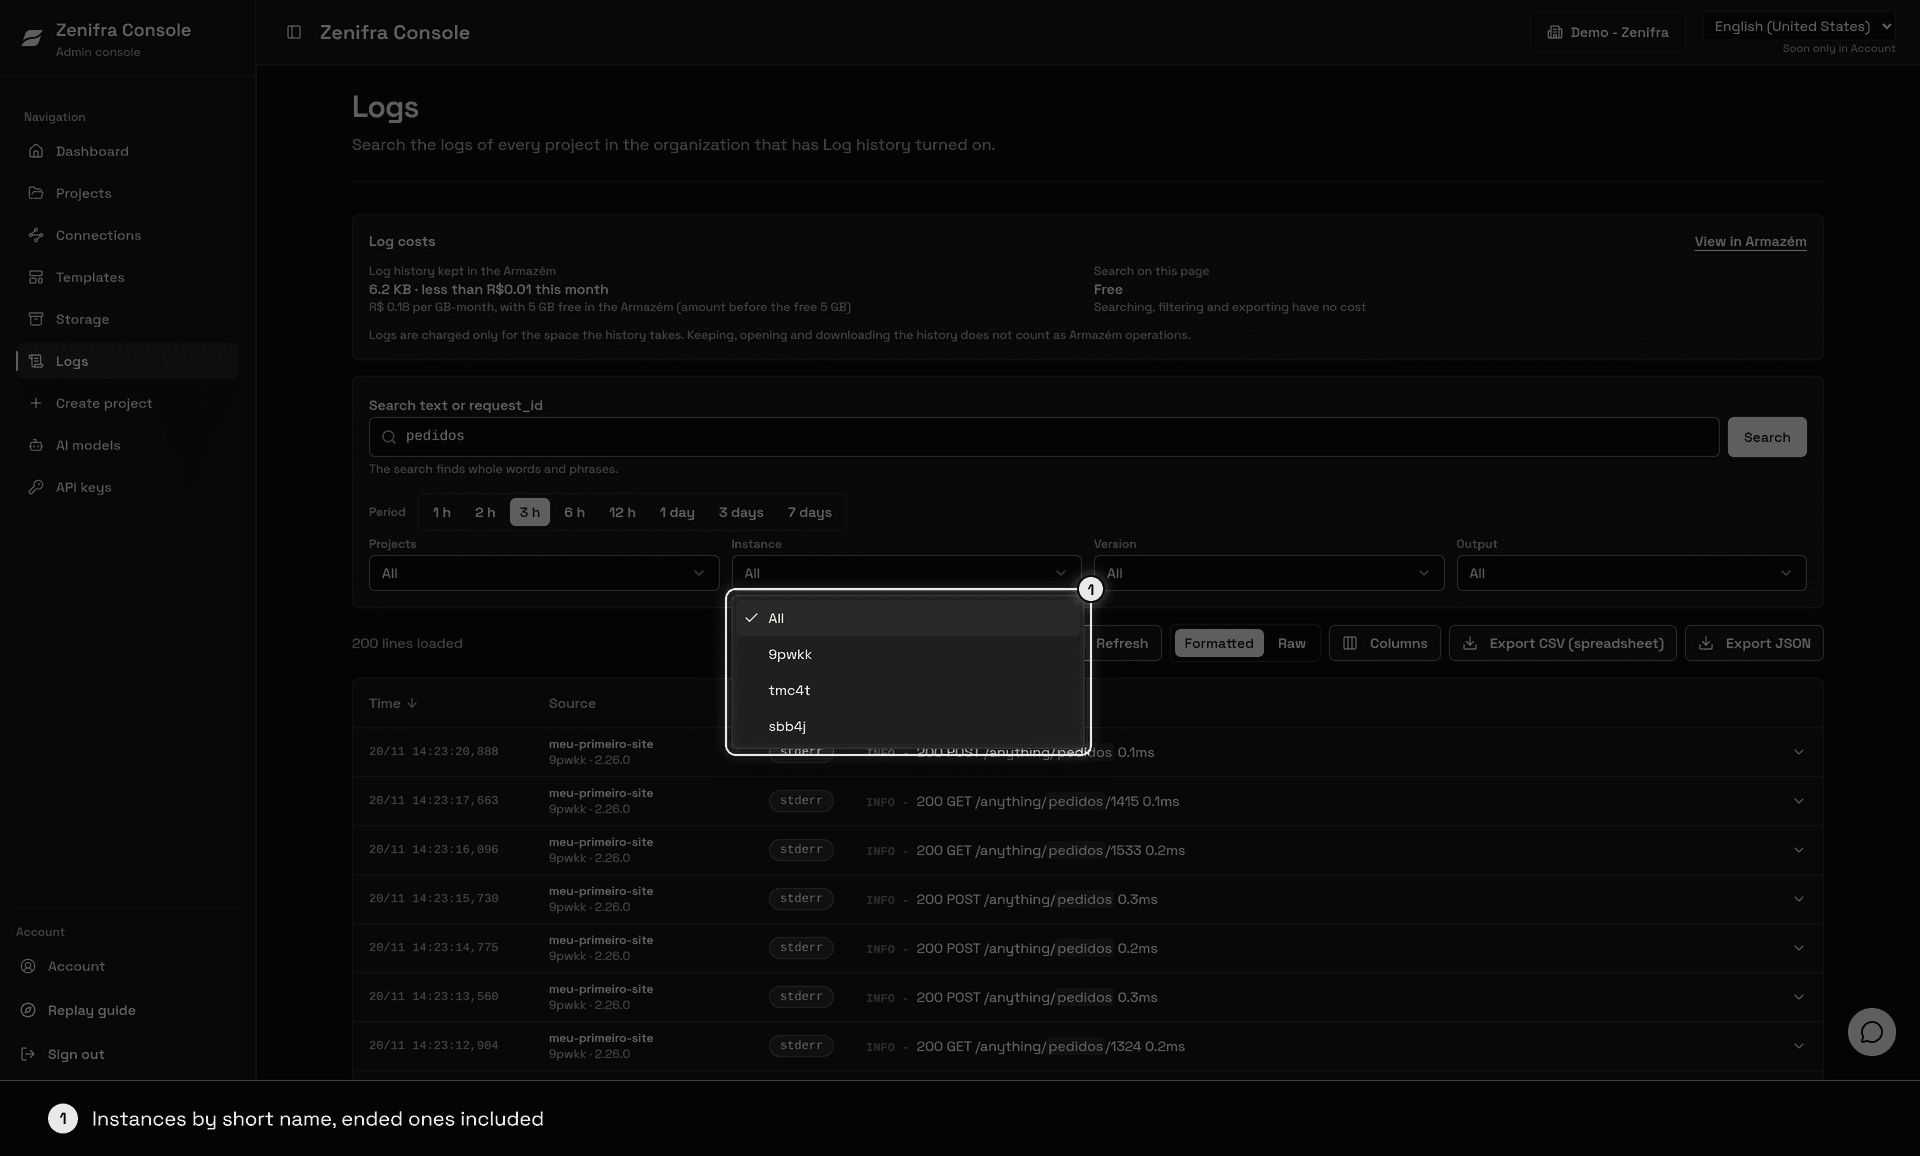
Use Clear filters to go back to the initial search and Refresh to repeat the search with the latest data.
Results
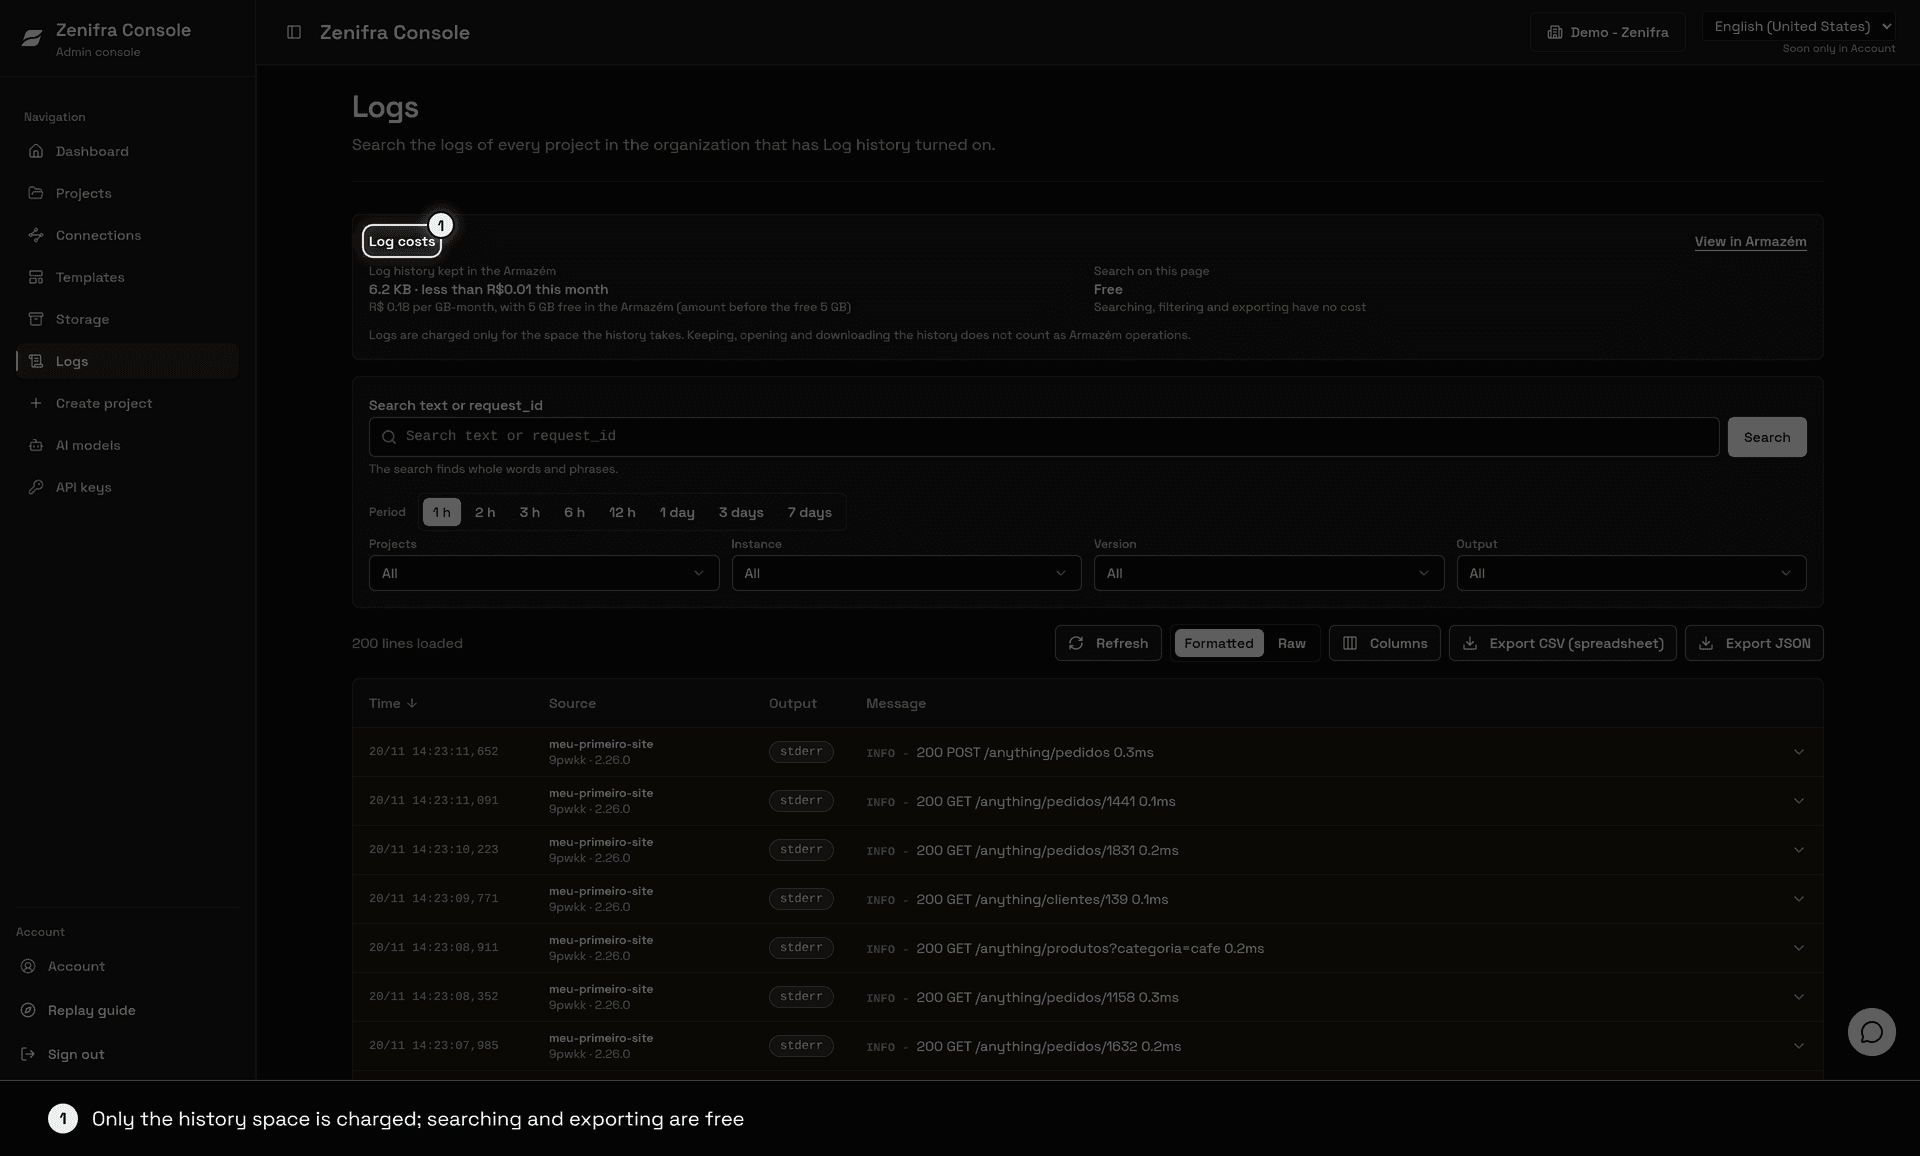
Each line shows:
- Time, in Brasília time;
- Source: the project and the short instance name with its version (for example,
my-projectandrjfvn · 1.27.3-alpine); - Output:
stdoutorstderr; - Message, with the searched term highlighted.
When there are more results, click Load more to see the next lines.
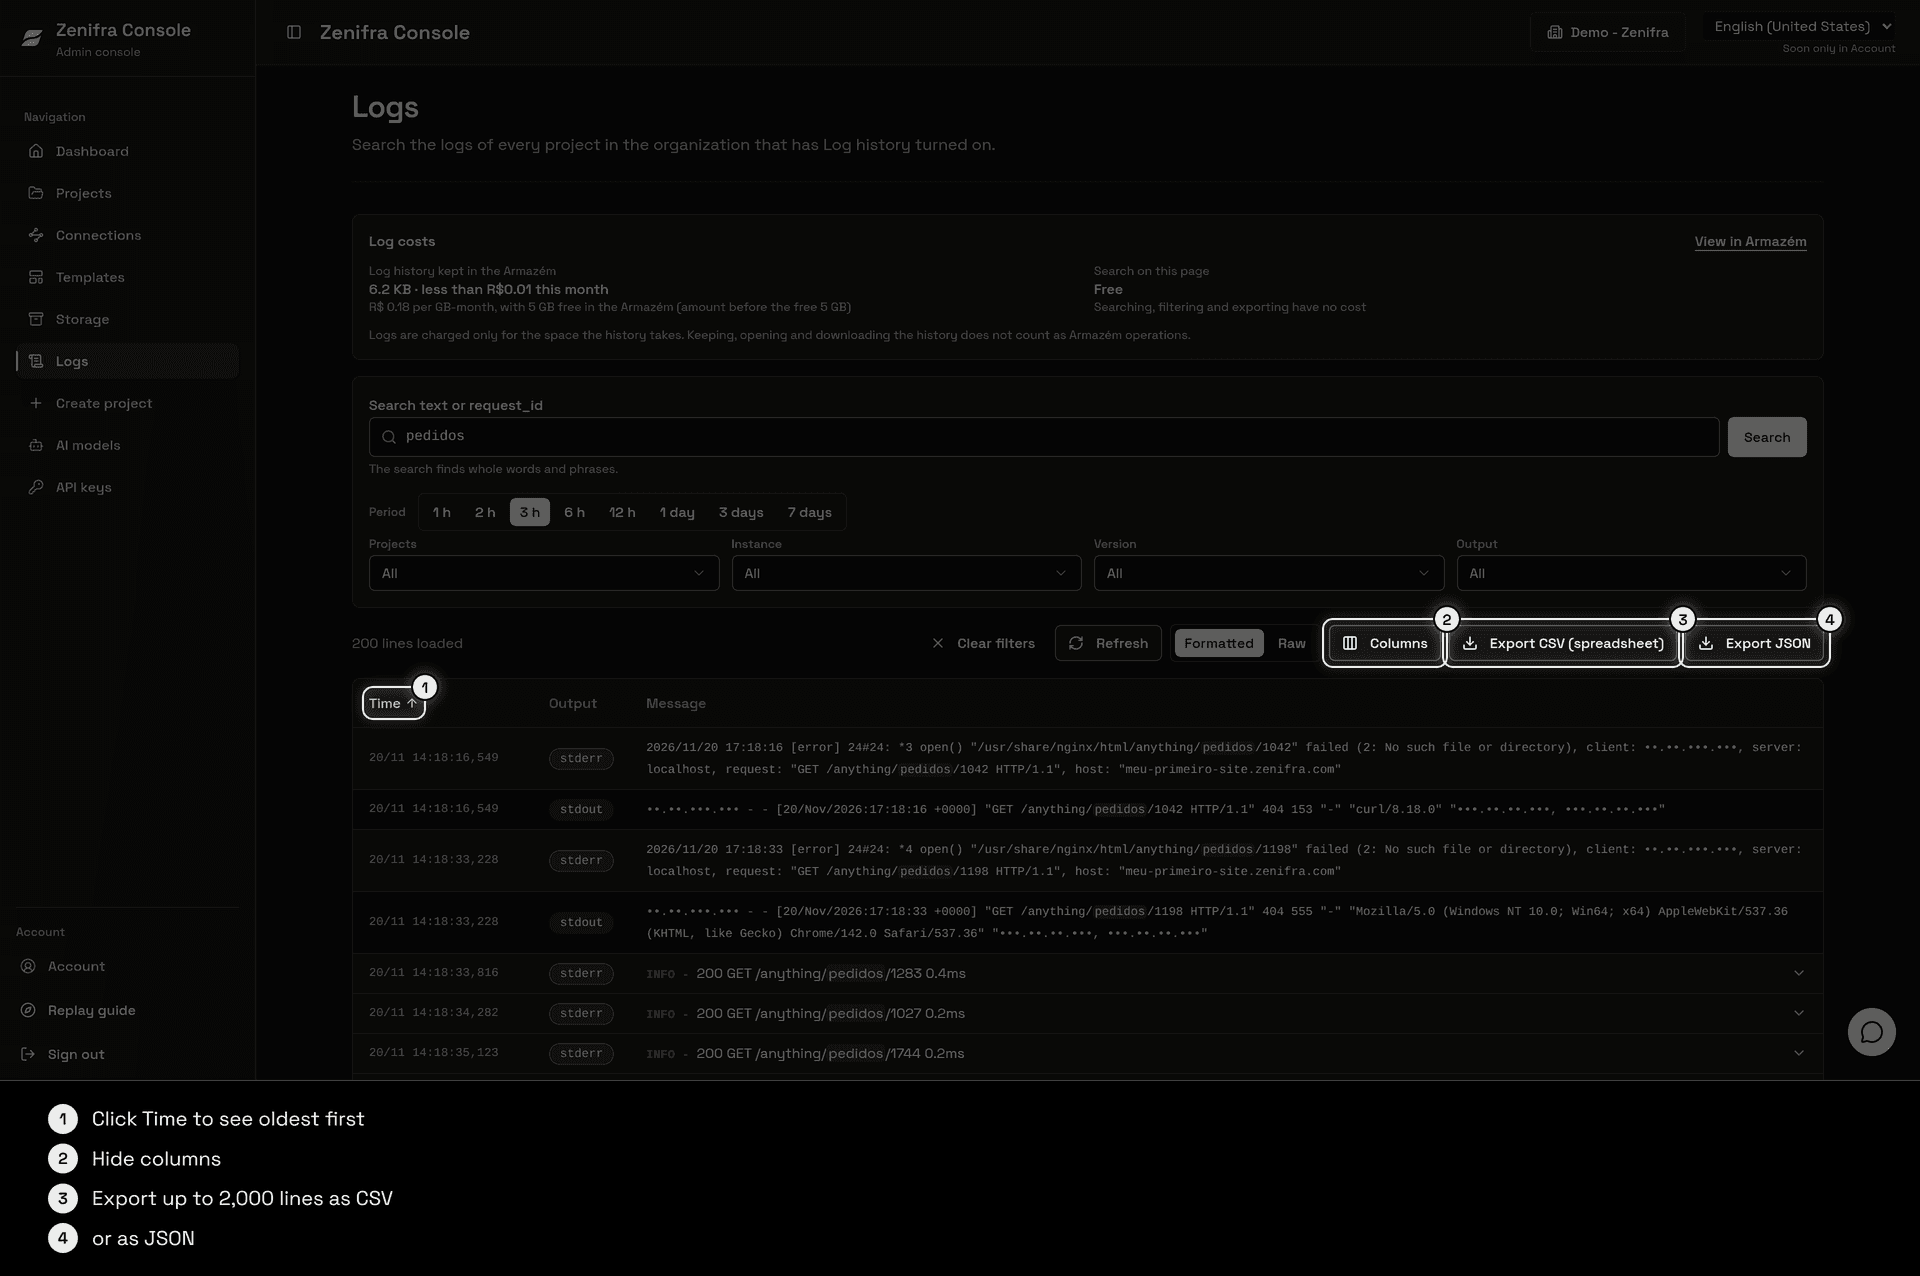
The time includes milliseconds. Click the Time header to see the oldest lines first; click it again to go back to the newest first. In Columns, hide Time, Source or Output; the choice is saved in your browser.
Formatted logs
In the Formatted view (the default), each line that is a JSON object shows as LEVEL - message, with the level in color (red for errors, yellow for warnings, blue for info). Click the line to see the whole JSON, indented. Lines that are not JSON show as they arrived. In Raw, every line shows as it arrived.
The console uses the first field that exists, at the top level of the JSON:
| Shows | Fields, in this order |
|---|---|
| Level | level, severity, lvl, log_level, loglevel |
| Message | message, msg, error, event |
Without any message field, the line shows the whole JSON. To get the formatted view, write one JSON object per line to the application output, for example:
{"level":"info","message":"order created","order_id":123}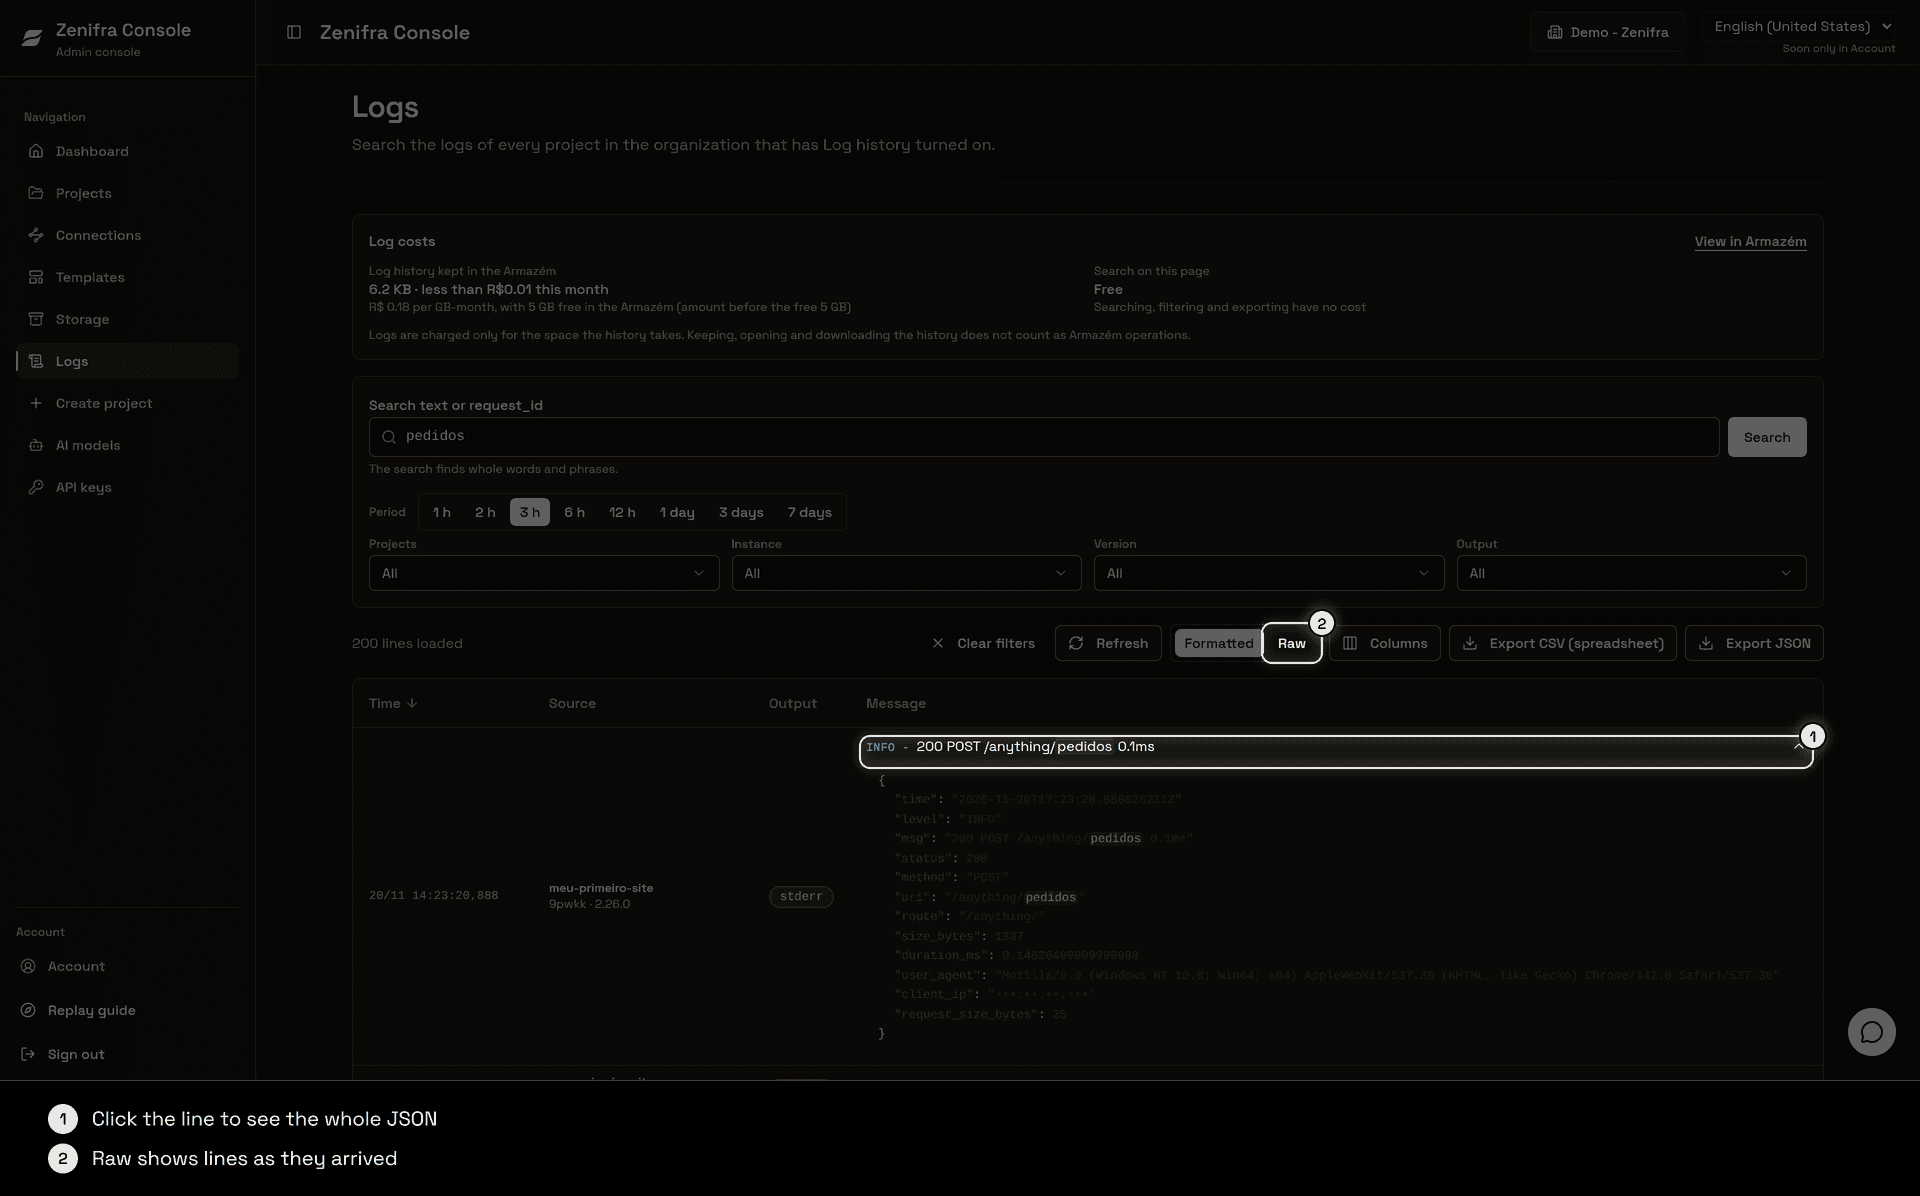
Export
Export the current search as CSV (spreadsheet) or JSON. Each export has up to 2,000 lines, and the console warns you when there are more results than the limit. To export the rest, shorten the period or use filters.
Project logs
In the Project logs card, on the project page:
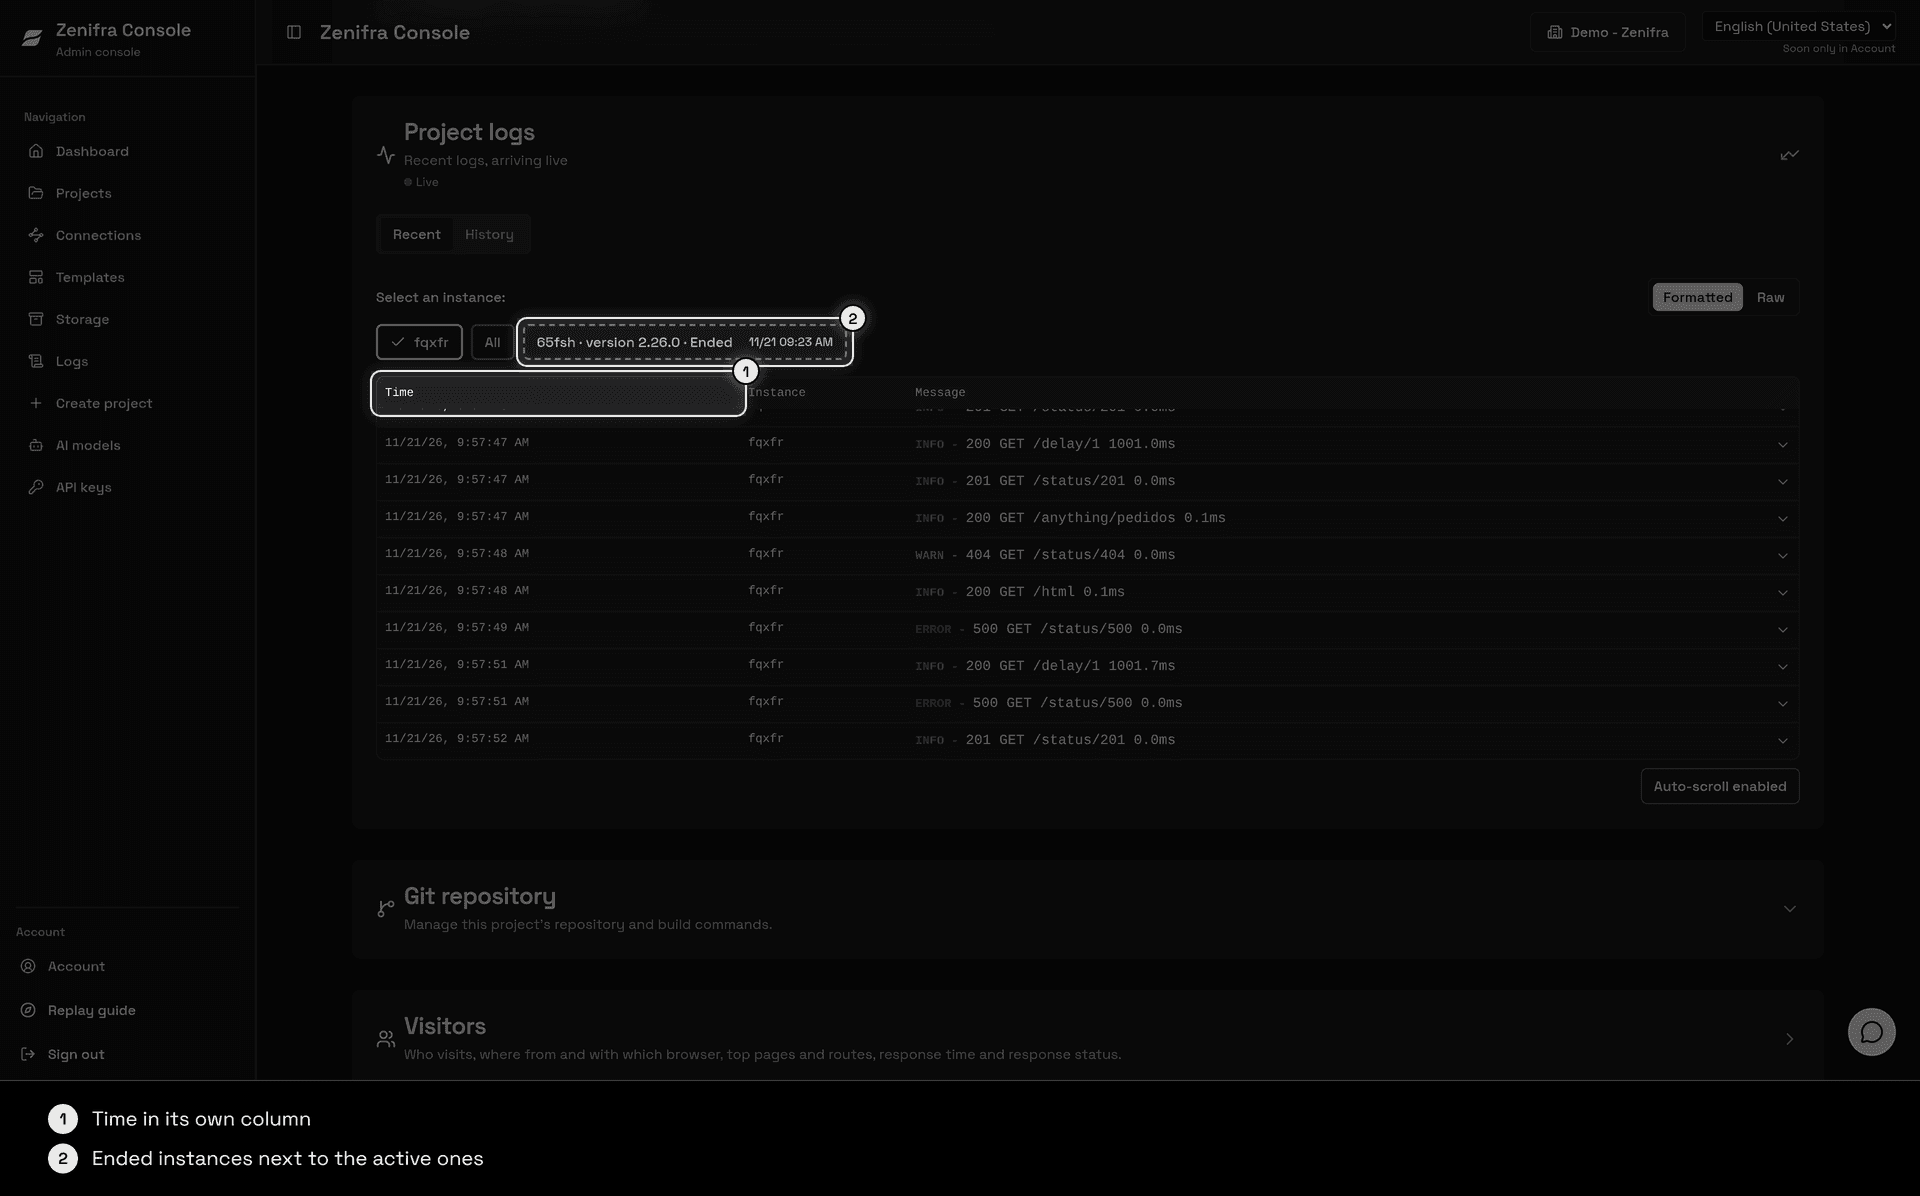
- the Recent tab shows lines live in a table with Time, Instance, Output and Message (see Live logs);
- terminated instances appear next to the active ones, for example
rjfvn · version 1.27.3-alpine · Terminated 11/19 20:41. Click one to see the last lines of that instance; - auto-scroll does not pull you back to the end while you are reading earlier lines.
Live logs
With the card open, the Recent tab shows the Live badge and the subtitle Recent logs, arriving live: new lines arrive in about 1 second, without reloading the page.
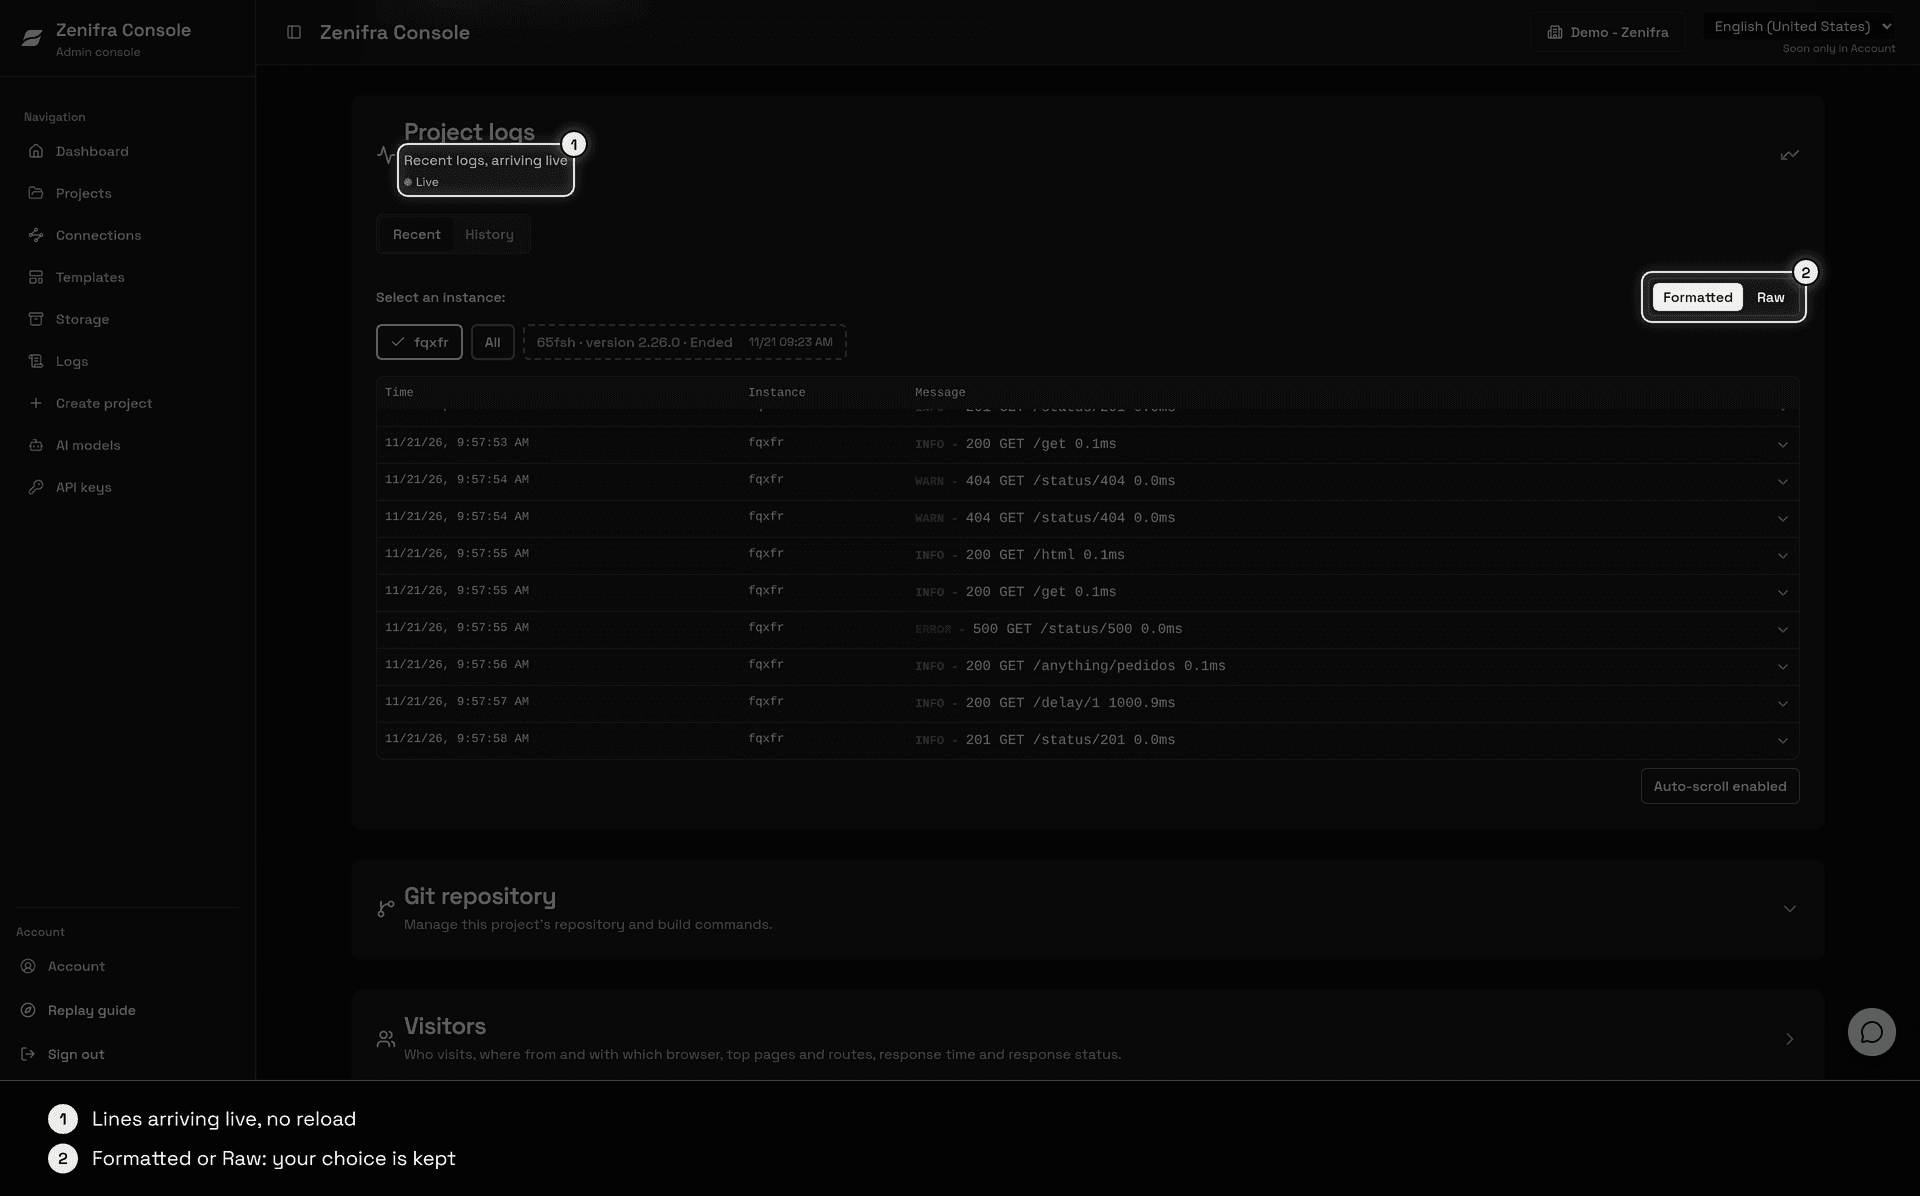
- When the browser tab is hidden, live logs pause. They come back on their own when you return to the tab.
- Formatted shows JSON lines with the level and the message; Raw shows the text as the application wrote it. The choice is kept in this browser and also applies to the Logs page.
- If live logs are not available, the card goes back to updating every minute and says why:
- Limit of live log views open in your organization reached: too many views with live logs are open at the same time in the organization. Close one to go live again.
- Live logs are at capacity right now: the card keeps updating every minute and tries to go live again on its own.
Cost
Logs are charged only for the space the history takes in the organization Armazém: R$ 0.18 per GB-month, with the first 5 GB of the Armazém free. Searching, filtering and exporting on the Logs page have no cost, and keeping, opening and downloading the history do not count as Armazém operations. The Log costs card, at the top of the Logs page, shows how much the history takes and how much it cost this month.
Limits
| Limit | Value |
|---|---|
| Search period | last 7 days, even if the history retention is longer |
| Searches per person | 30 per minute |
| Searches at the same time | 2 per organization |
| Time per search | 30 seconds |
| Lines kept per instance | 30,000 per minute; the excess is dropped |
| Size of each line | 16 KB; the rest of the line is cut |
| Export | 2,000 lines per file |
| Views with live logs | limited per organization; above the limit, the card updates every minute |
- If you see Too many searches in a row, try again shortly, wait a few seconds and search again.
- Very broad searches can take longer than 30 seconds. Shorten the period or choose specific projects.
- Lines show up on the Logs page about 20 seconds after the application writes them. To follow the latest lines, use the project's Recent tab.
Next steps
Last updated on
Observability
Monitor Zenifra projects: logs and email alerts on every plan and, depending on the plan, CPU, RAM, HTTP traffic, health checks, and database snapshots.
Production deploy on Zenifra
Complete guide to publish an application in production on Zenifra with GitHub, GitLab, Forgejo, or an OCI image: variables, database, logs, metrics, billing.